Hi guys, i'm going to do the blog in bullet point form in the next few post, so you don't have to read the whole paragraph. Let me know how you like it?
(Daily Chart)

- SPY continues to bounce on the 20-day moving average (yellow in color).
- SPY has been making higher highs (peak #1 & peak #2) and high lows (valley #1 & valley #2), signaling the trend goes higher.
- The green bar at valley #2 has the highest volume in the last 10 trading days and reversed the previous 2 days’ drop, which signals an upward continuation on the SPY.
- I expect the trend to go higher and find resistance at the 2008’s high @ $143.32.
- Pullback will happen as the SPY continues higher; Support #2 @ $137.95 will be the first major support level on the uptrend. Support #1 @ $134.64 is another major level, if the SPY breaks below Support #1 and the following candlestick opens below the support #1, this is a confirm reversal signal on the broad trend.
(Hourly Chart)
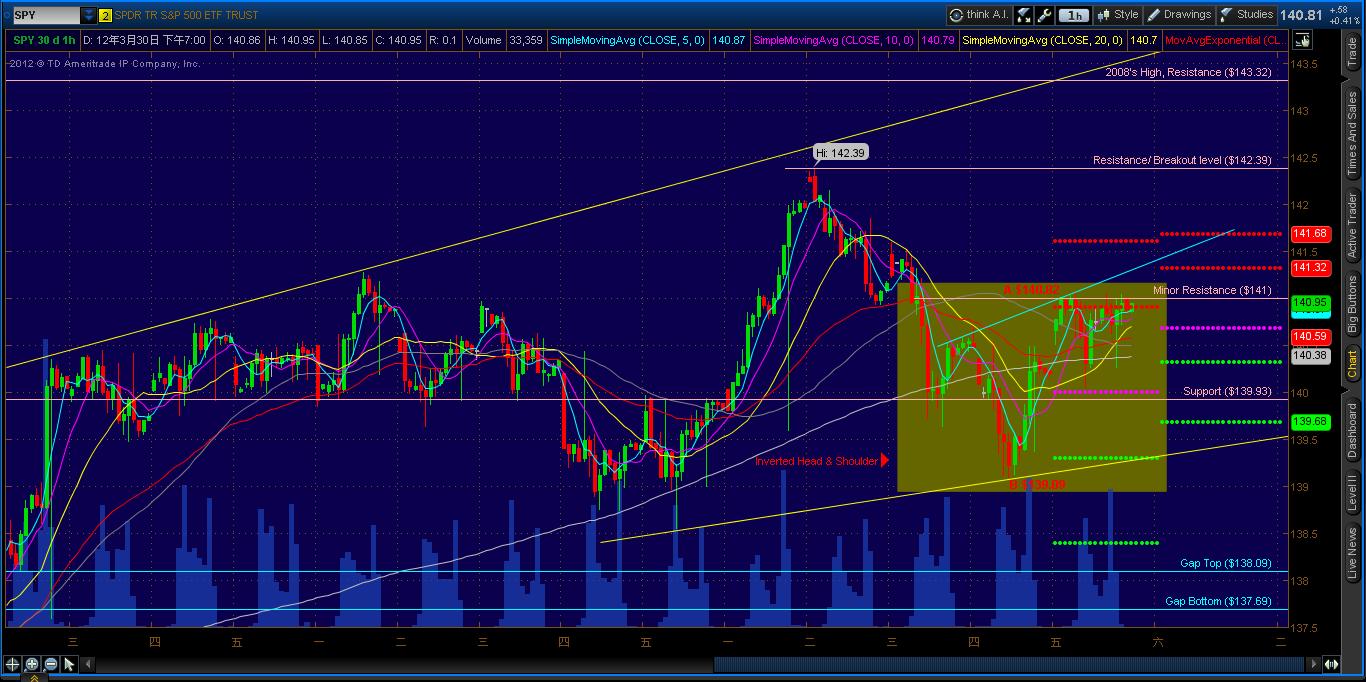
- The SPY developed an inverted Head & Shoulder pattern in the last 3 trading days. To find the technical target on this pattern is to add the perpendicular distance between the head and neckline (light blue in color) to the pattern breakout point. That is:
= $140.82 - $139.09 + breakout point
= $1.73 + the price level where the SPY crosses the neckline.
- The SPY found a flat top @ $141, it may experience minor resistance at this level in the next 2 trading sessions.
- If the SPY breaks the 52-weeks high @ $142.39, the breakout should take the SPY up to the 2008’s high @ $143.32.
- The 50 SMA (grey in color) is about to cross below the 200 SMA (white in color); when this happens, this may bring in more selling pressure to the intra-day trading session.
- (Possible Trade) >> Long at support @ $139.93
- Risk: Sell the position when it breaks the previous low @ $139.09
- Target: Sell 50% at the breakout level @ $142.39 and run the rest to the 2008’s high @ $143.32
(15 mins Chart)

- A few bearish signals are seen in this chart.
- The flat top found at the $141 level is also the 61.8% fib retracement level from last week’s top to low, signaling a potential 1-2-3 continuation to the downside.
- If the SPY can’t break the $141 level to the upside, it may develop into a double tops pattern. The bearish double tops pattern will be confirmed when the SPY drops below the middle valley @ $140.17 and the target on this pattern locates at $139.19.
- (Possible Trade) >> Short the double tops at current price @ $140.95
- Risk: stop 50%@ $141.1 and stop the remaining 50% @ $141.25
- Target: cover 50% @ $140.17, cover 25% @ $139.93 and use trailing stop for the remaining 25%
I hope this post offers you some insight, thank you for reading and please feel free to give me some feedback.
No comments:
Post a Comment