Light Sweet Crude Oil Futures (/CL)
(Daily)
-
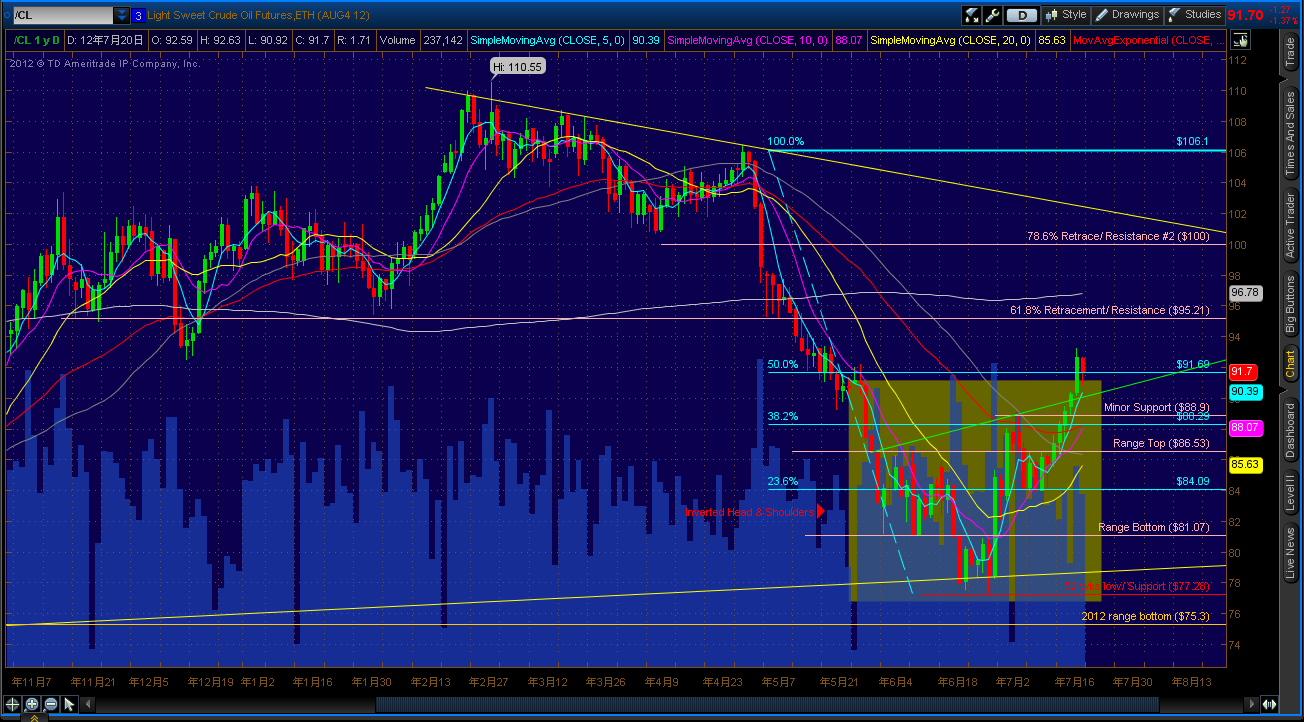
Since the last post, the crude oil
futures price made a new 52 weeks low @ $77.28 but reversed right on the upward
sloping trend line from the weekly chart of last post.
-
By looking at the recent up
move, the oil futures completed a 1-2-3 pattern rally from the bottom: 2 big
green bars leading up to the consolidation area, between the 23.6% and 38.2%
retracement levels @ $84.09 - $88.29, then broke out from the range and took the
futures price up to the $90s area.
-
The oil futures formed an
inverted head and shoulders pattern, a bullish signal, with the green upward sloping
trend line serving as the neckline, or confirmation of breakout. Given the
recent break of the neckline, I'm expecting the oil futures price to push up a
little further until it meets resistance @ $95.21 and consolidates again. The
$95.21 level is where the oil futures price previously based and it is also the
61.8% retracement of the big down move happened in May 2012, some selling
pressure should be seen as the oil futures price approaches this level.
-
If the oil futures price
continues to go higher, the 200 day moving average (200 SMA, white in color) and
the whole number level @ $100 will serve as resistance levels. The 200 SMA is
always a decent support/resistance reference while the $100 mark is a
psychological gauge. Historically, stocks and futures prices like to flip up
and down around this particular whole number. It is unlikely for the oil
futures price will go right through this level without any kind of
consolidation beforehand, therefore I believe this is a rather important level
to watch.
-
For downside support, the green
upward sloping trend line is the 1st layer of support if the oil
futures price drops. The 2nd layer of support includes a minor
support level @ $88.9, the previously range top level @ $86.53 and the 38.2% Fibonacci
retracement level @ $88.29. The last support on this uptrend is the 23.6%
retracement level @ $84.09, which the oil futures price based before the recent
breakout. If the oil futures price forms a low, or trough, lower than the
$84.09 level, this may signal an uptrend reversal. The best scenario is the oil
futures price trades between the resistance level @ $95.21 and the green trend
line, forming a bull pennant pattern that favors an upward breakout as the
candlesticks come to the edge of the pattern.
(Hourly)

-
In the hourly chart, one can
see the oil futures price broke out from the upward channel on last Thursday
but failed to continue further. Then it dropped back into the upward channel area
and formed an intra-day double bottom, which is a higher low as well. The formation
of higher high and higher low indicates the trend is still on the upside; oil
future price shall push up again, but it needs to make a high, or peak, above the
$93.25 level in order to maintain the upward trend. As long as the move
continues to make higher high and higher low, going long in oil is still in
play.
-
On the other hand, if the oil
futures price breaks below the upward channel, watch out for a short term down move
that brings the futures price down to the area between minor support and the 23.6%
retracement levels (from daily chart) @ $84.02 - $88.9.
-
Notice there is a rising 200
moving average (200 SMA, white in color) currently sitting at $88.07; if the
futures price drop, the 200 SMA should offer another source of support to hold
up the price.
I
hope this post offers you some insight, thank you for reading and please feel
free to give me some feedback.
No comments:
Post a Comment